

Political markets move on stories. Machines only “read” stories if we turn them into numbers. This week 3DN stood up a small, local machine-learning spine for PolitiCap: every English desk article is embedded into a Postgres vector database, then joined to real executed trades on the civic tape. The goal is not a casino crystal ball. It is a local, inspectable model that may eventually help forecast short political swings on virtual tickers — if the community generates enough honest trading activity to learn from.
Sign up and trade: politicap.eu — free account, dibs (virtual DutchBud credits) on a closed-loop ledger. More trades after real news events = better labels for the net.
What we built
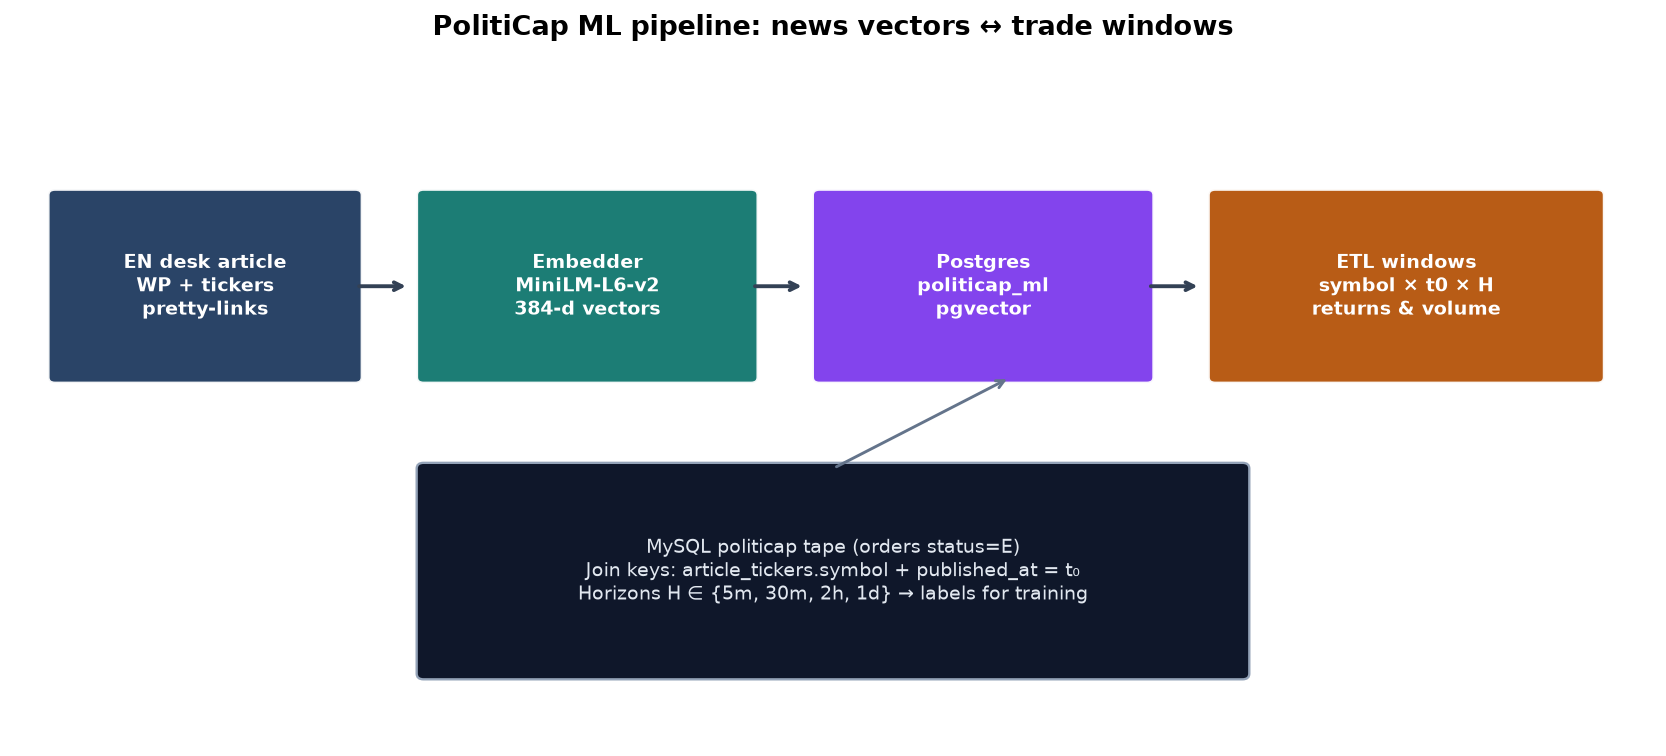
The pipeline is deliberately boring and fleet-local:
- EN article on politicap.eu (pretty-linked tickers in the body).
- Embedder
sentence-transformers/all-MiniLM-L6-v2→ 384-dimensional vectors (same family as our fleet RAG). - Postgres database
politicap_mlwithpgvector(HNSW cosine indexes). - ETL builds
article_symbol_windows: for each article×symbol×horizon, pull executed orders after publish time.
Vectors: what “similarity” means
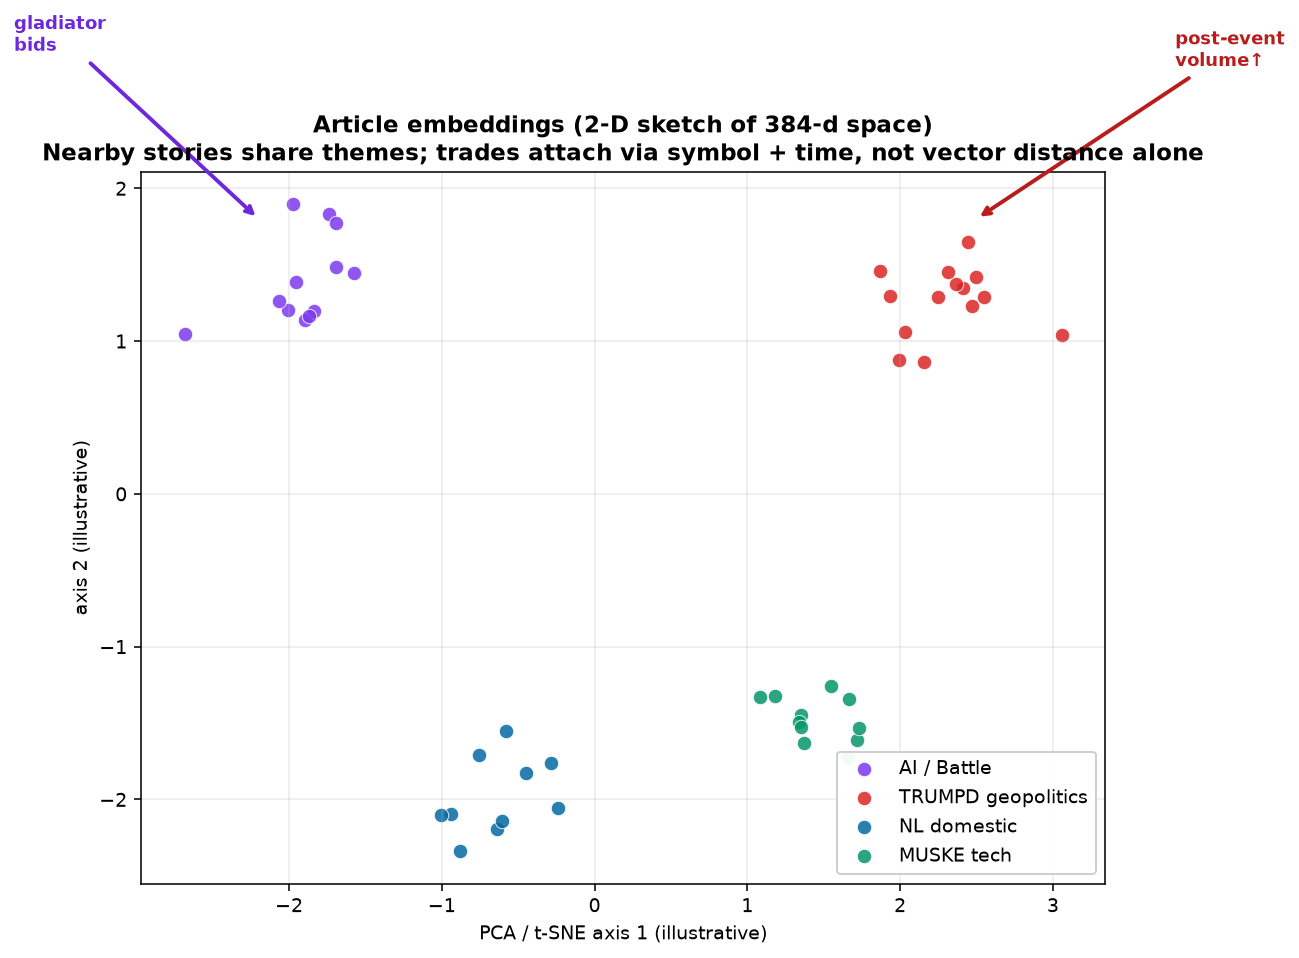
Each English post becomes a unit vector e in ℝ384. Chunks of the body get their own vectors for finer retrieval. Nearby points in that space tend to share themes (AI race, TRUMPD geopolitics, Dutch cabinet wire).
Cosine similarity between two L2-normalised vectors u and v collapses to a plain dot product:
sim(u, v) = (u · v) / (‖u‖ ‖v‖) = uᵀ v
That is useful for “stories like this one.” It is not by itself a price forecast. Trades enter through a different door.
How trades attach to embeddings
We never stuff order IDs into the vector. The join is an event spine:
article_tickers.symbol— who the story is about (fromdata-symbolpretty-links).articles.published_at = t₀— when the news event starts (UTC).- Horizons H ∈ {5 min, 30 min, 2 h, 1 day} — only activity after t₀ counts as reaction.
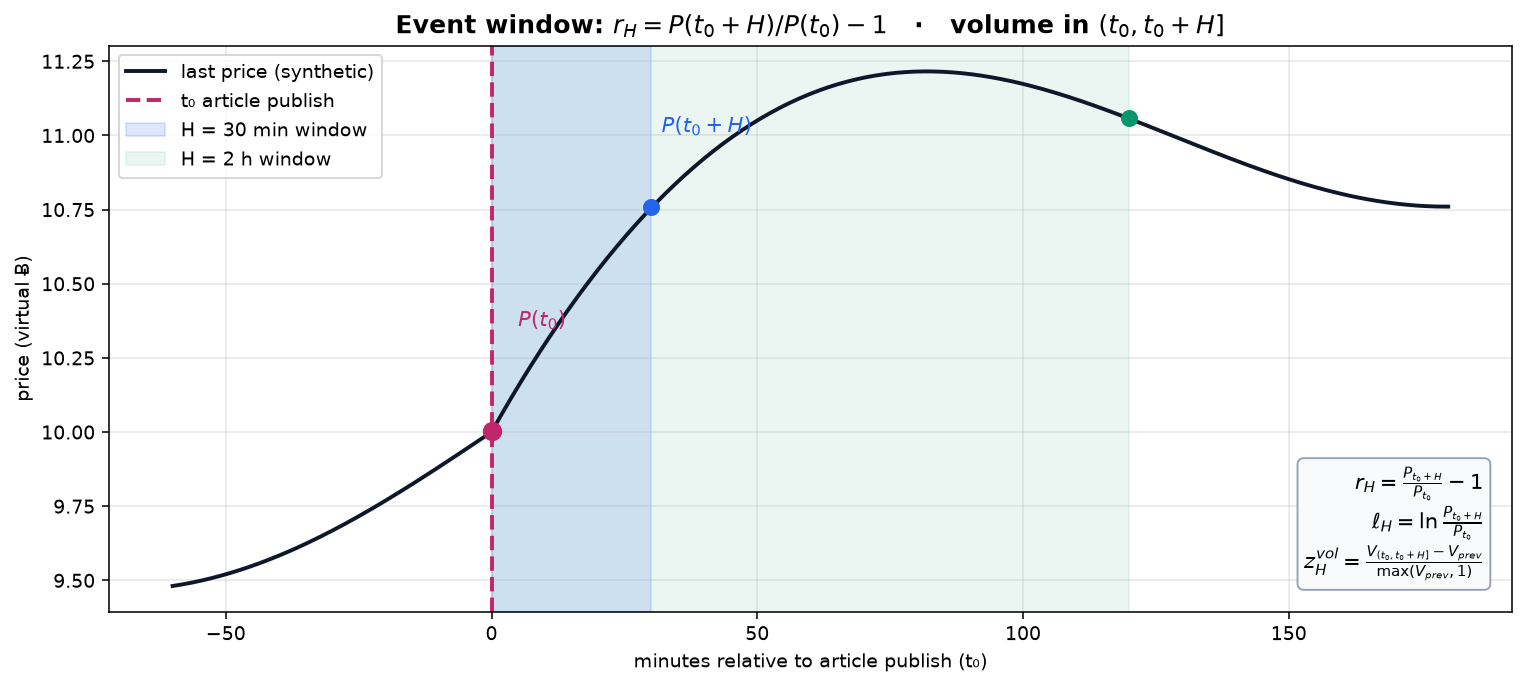
For last price P and executed volume V in the window:
- Simple return:
r_H = P(t₀+H) / P(t₀) − 1 - Log return:
ℓ_H = ln P(t₀+H) − ln P(t₀) - Volume shock:
z_H = (V_after − V_prev) / max(V_prev, 1)comparing the post-event window to the equal-length window just before t₀
Those numbers land in article_symbol_windows next to the embedding. That table is what a neural net (or a boring gradient booster) actually trains on.
A predictive model — without the hype
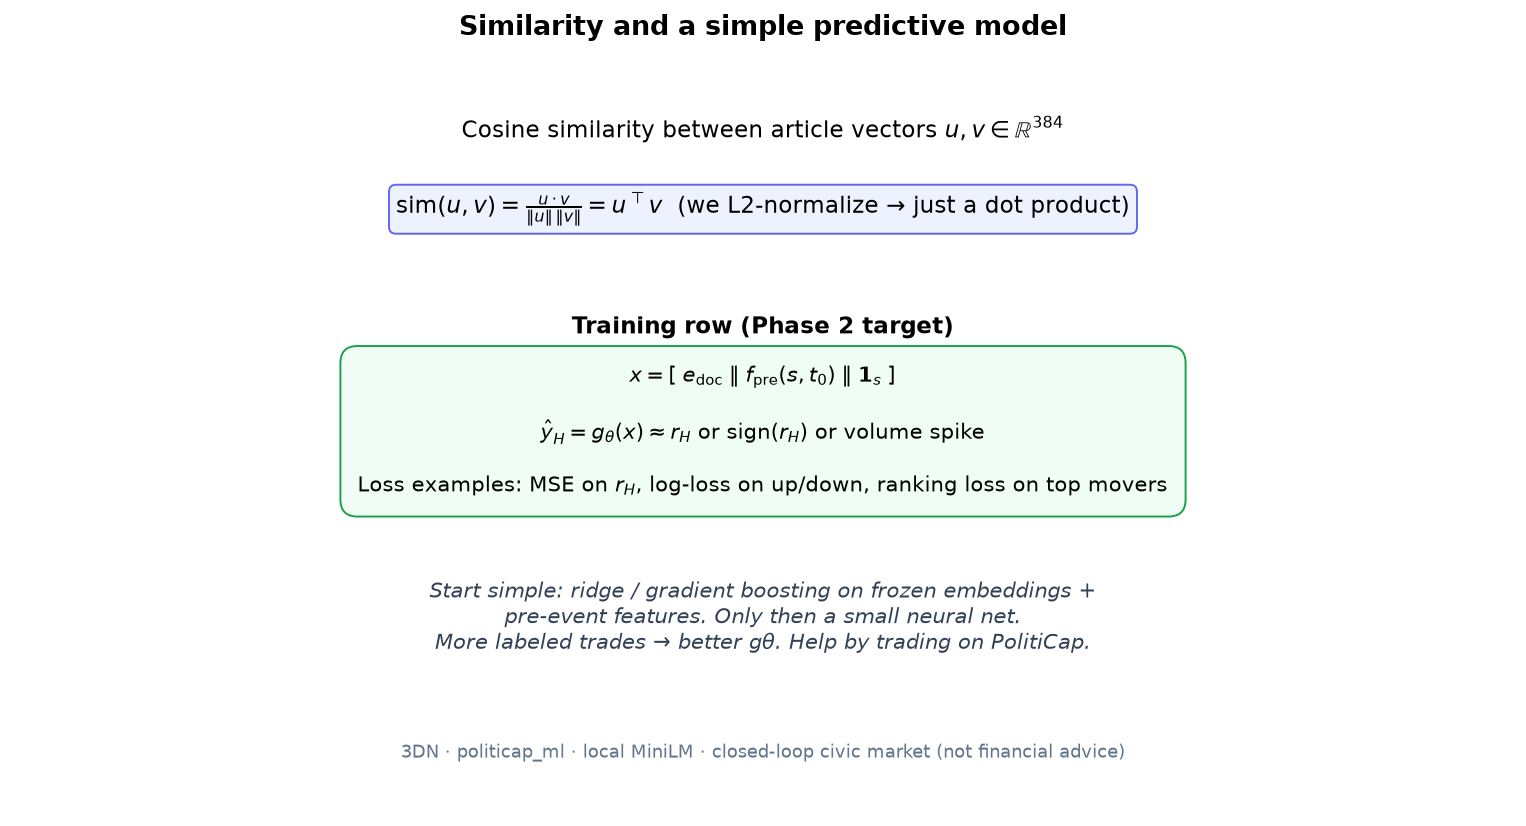
A training row looks like:
x = [ e_doc ‖ f_pre(s, t₀) ‖ 1_s ]ŷ_H = g_θ(x) ≈ r_H or sign(r_H) or “volume spike”
Here e_doc is the frozen article embedding, f_pre are market features before the news (so we do not leak the answer), and 1_s tags the symbol. Start with ridge or gradient boosting on frozen MiniLM features. Only then a small neural net. Walk-forward splits by time. Beat a dumb baseline first.
Disclaimer: PolitiCap is a civic game with virtual DutchBud credits — not licensed securities advice, not a prediction market for fiat cash-out. A “successful” model means better description of virtual tape dynamics, not a claim you can bank on in the real world.
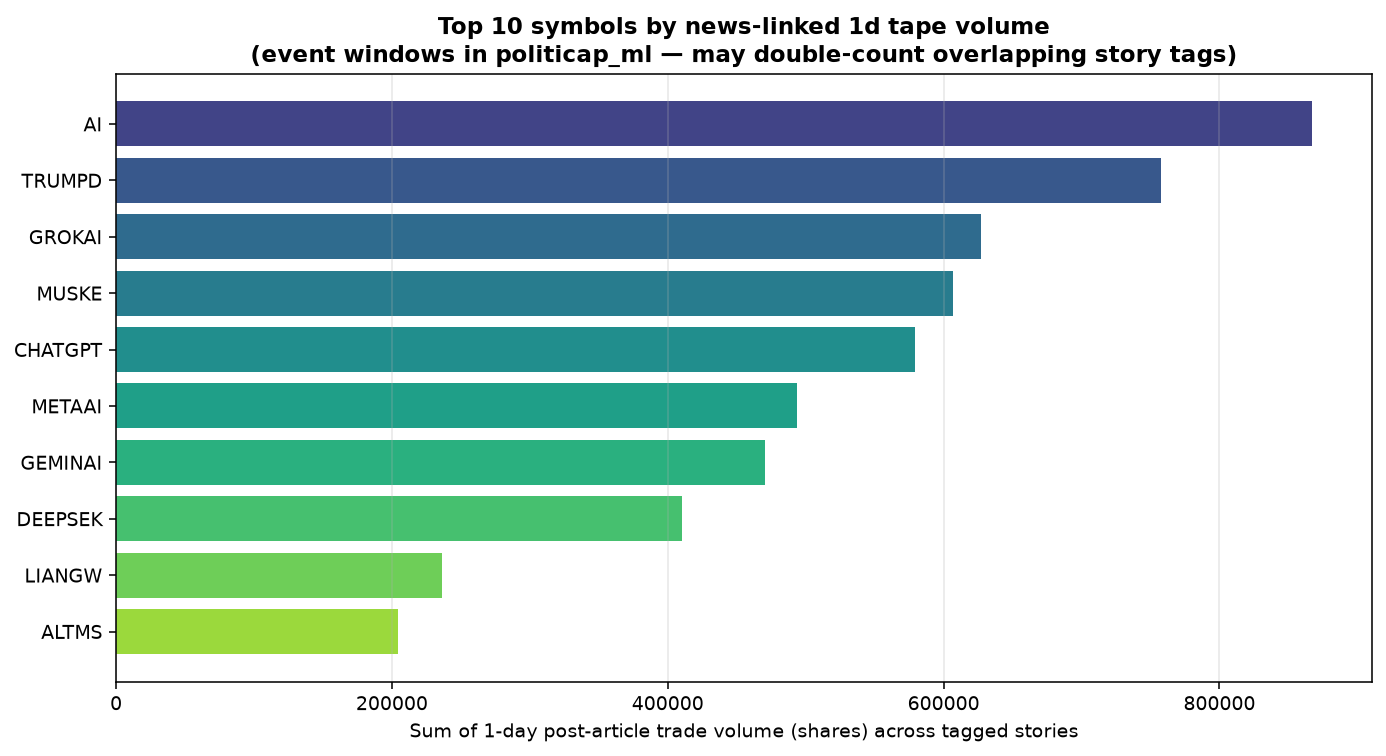
First map: top 10 symbols by news-linked 1-day volume
After embedding 203 English posts and joining ~247k executed fills, these symbols carried the most post-article volume in 1-day event windows (summed across tagged stories — overlapping AI posts can share the same day’s tape):
| # | Symbol | 1d volume (sum) | Top news drivers (by window volume) |
|---|---|---|---|
| 1 | AI | 867 247 | Let there be Light; China AI slowdown “Cold War playbook” |
| 2 | TRUMPD | 757 480 | GROKAI learns candles; TRUMPD Iran-plan tape; Taiwan survey |
| 3 | GROKAI | 627 238 | Let there be Light; China AI slowdown; AI Index free-float soak |
| 4 | MUSKE | 606 844 | FBI Grassley emails; MUSKE/MENGW IPO; candles battle note |
| 5 | CHATGPT | 579 296 | Let there be Light; China AI slowdown; free-float soak |
| 6 | METAAI | 493 536 | Same Battle / AI-index cluster |
| 7 | GEMINAI | 470 226 | Same Battle / AI-index cluster |
| 8 | DEEPSEK | 410 550 | Same Battle / AI-index cluster |
| 9 | LIANGW | 236 176 | GROKAI learns candles (primary) |
| 10 | ALTMS | 204 734 | GROKAI learns candles; Grok 4.7 desk note |
Pattern: Battle of the AIs listings and TRUMPD/MUSKE geopolitics dominate labeled volume. That is exactly the kind of repeated event structure a local model can learn — if humans keep showing up on the book when the desk drops a wire.
How people make the model better
- Trade after real news — your fills become (symbol, t₀, H) labels. Thin books teach noise.
- Use the ticker links — pretty-links are the join keys into the tape.
- Do not game empty symbols — wash volume without news confounds the windows.
- Stay on the closed loop — dibs / DutchBud virtual bank language keeps the civic market honest: fintech spine, not casino cash-out.
Create a PolitiCap account → play the civic market, leave a trail of trades the lab can learn from.
Stack notes (for the curious)
- DB:
politicap_mlon fleet Postgres with pgvector - Embed on publish: desk skill runs
embed_en.py --only-idfor every EN post - Windows ETL: executed orders (
status=E) from the PolitiCap MySQL book - Next: walk-forward baselines, then a small net — still local, still ours
3DN builds the rails: sovereign compute habits, open tooling, and products that stay under our fingers. A predictive civic tape is one more reason the stack — hosting, bank, marketplace, PolitiCap — belongs together.

Leave a Reply